
A look into just how quick some census surveys can be
As any consistent reader of our blog or any passing fan of census data would know, there are a lot of different surveys held year round. We talked a bit about this a couple months back, but what wasn't covered as much there was the "experimental survey."
Experimental surveys, as conducted by the United States Census Bureau, are "innovative statistical products created using new data sources or methodologies that benefit data users in the absence of other relevant products." For a potent example of how important experimental surveys can be, they were prominently used in 2020 for the COVID-19 pandemic when traditional census practices were inhibited. One such that is still recurring is the Household Pulse Survey.
Where experimental surveys are testing grounds for new ways of gathering and analyzing data, with the potential to become permanent products, the Household Pulse is one such venture to analyze the effects of the pandemic on households. This is done under a variety of metrics from the employment status of households to education status and mental health, but that's just scratching the surface. One attribute that makes this survey "experimental" is that it is a rapidly done process that intends to release much of its results in real-time; while many more prominent surveys have a typically annual release cycle, the Household Pulse is released consistently throughout the year as its data is gathered and authorized.
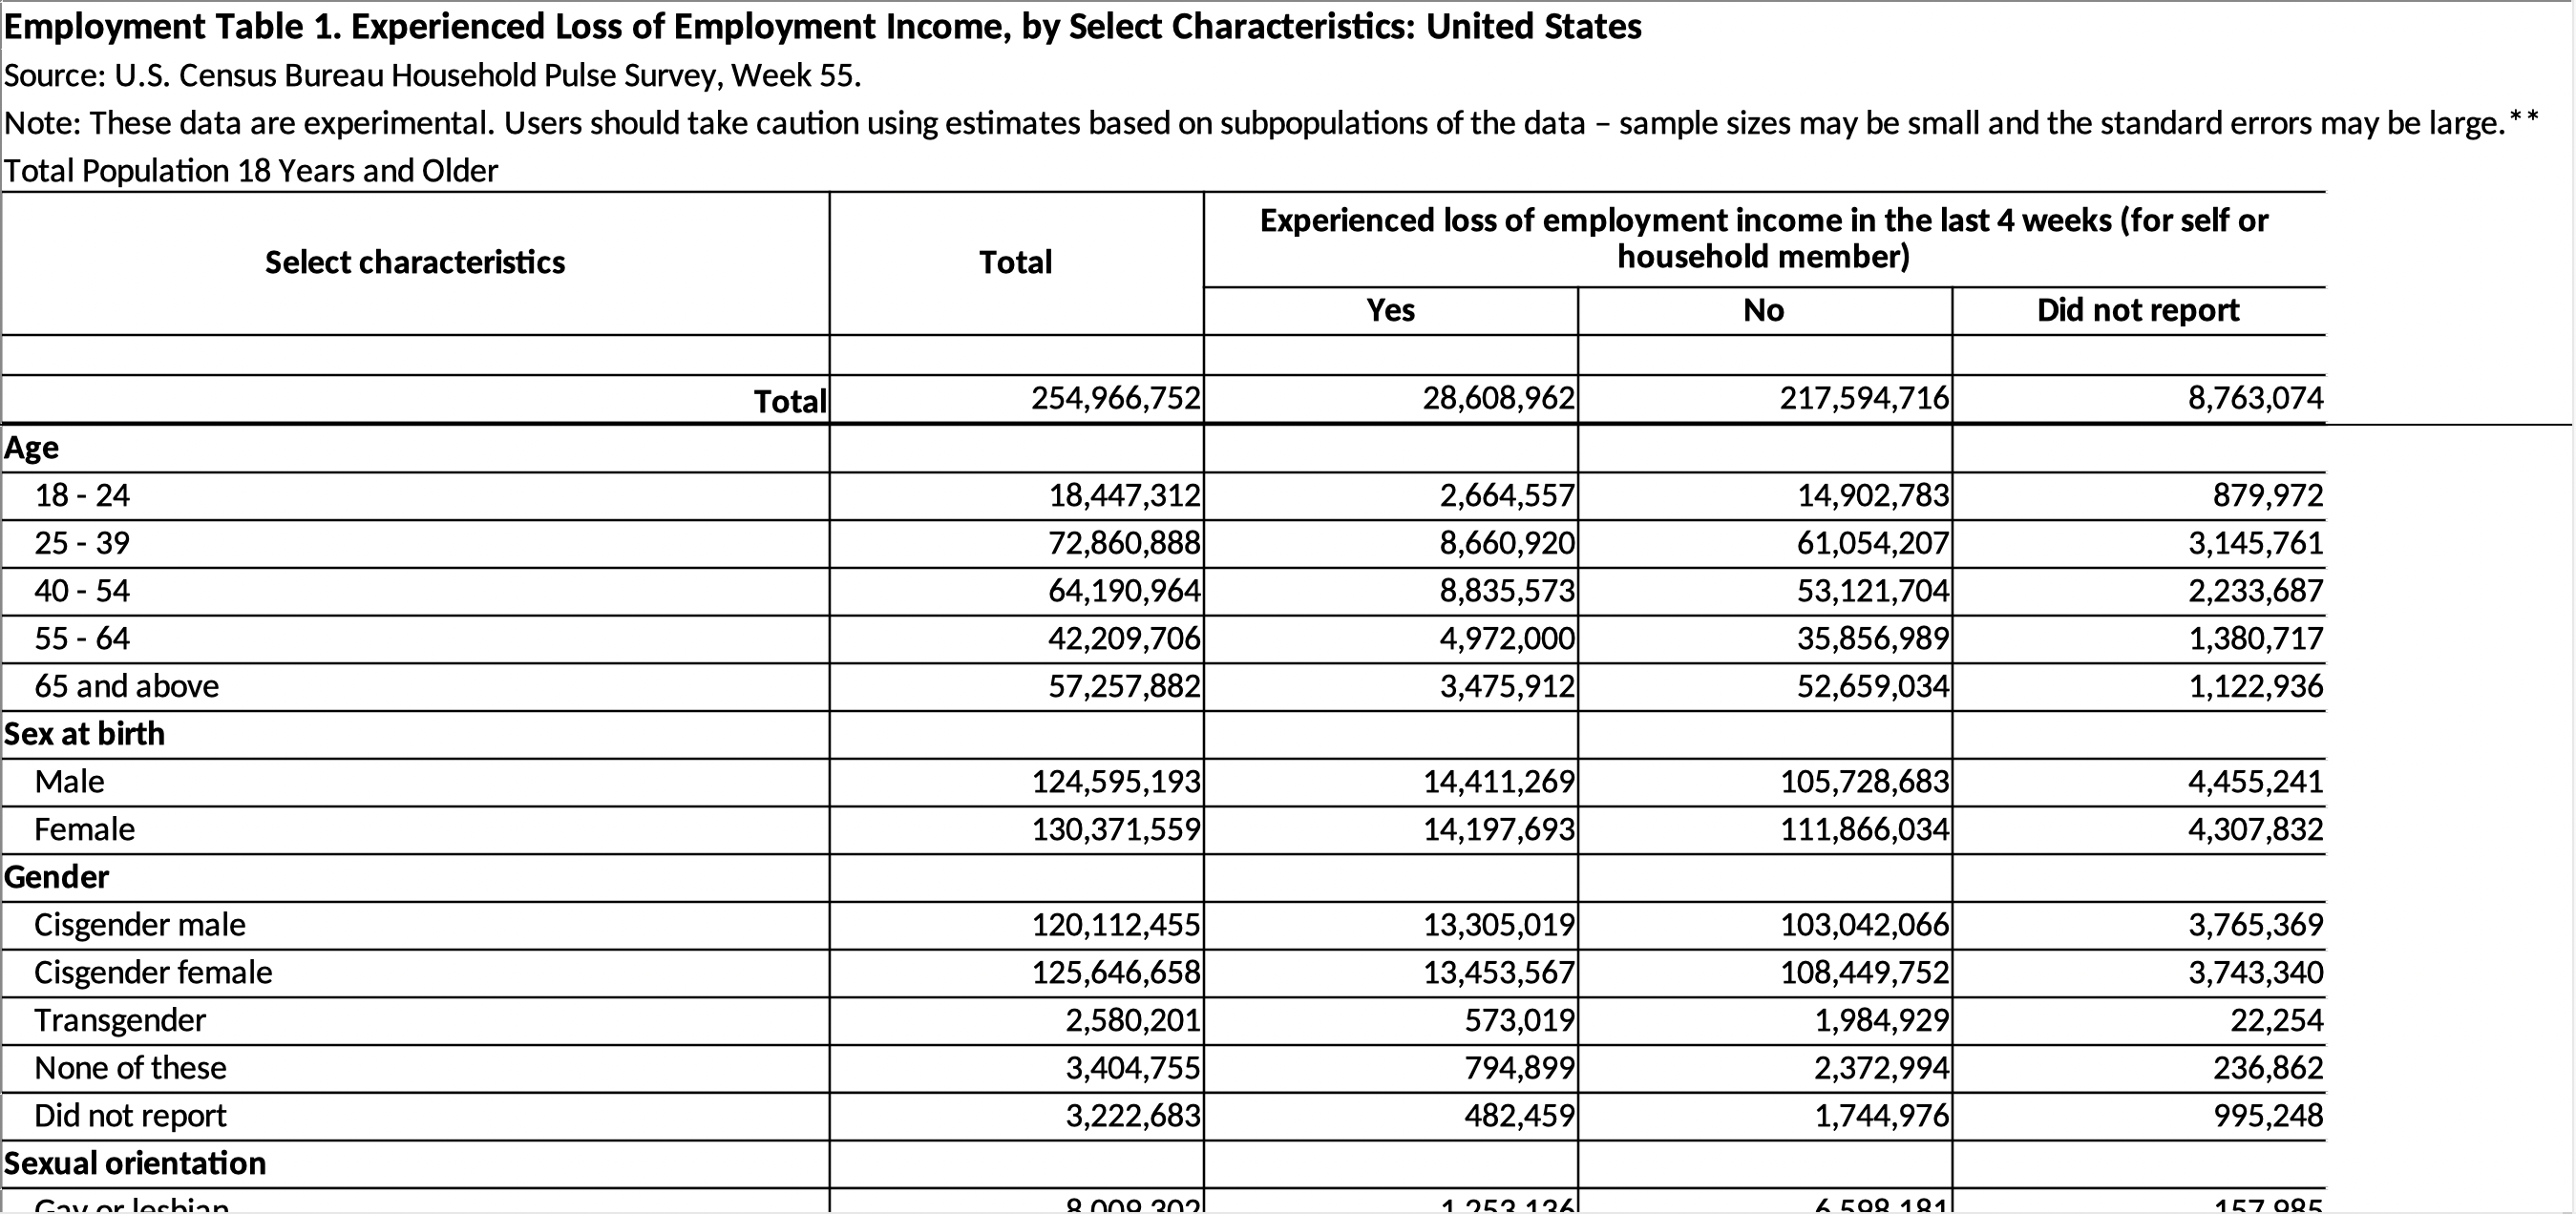
The Household Pulse covers a wide range of categories, and then its specific tables work to get as specific as they can about what effects transpired as a result of the pandemic. For employment, as an example, tracking the timelines under which loss of employment occurred and how many applied for and consequently received benefits are vital data resources to have reported for the government and other agencies to act upon. This goes hand in hand with other things such as changes to childcare, reports of anxiety and depression amongst households, loss of access to public utilities, and on and on.
Now, for an example of what a questionnaire for the survey looks like, you can look no further than the publicly released version on the Census Bureau's website. For a more concise and exploratory presentation of the data, you also have the Household Pulse Survey Interactive Tool.
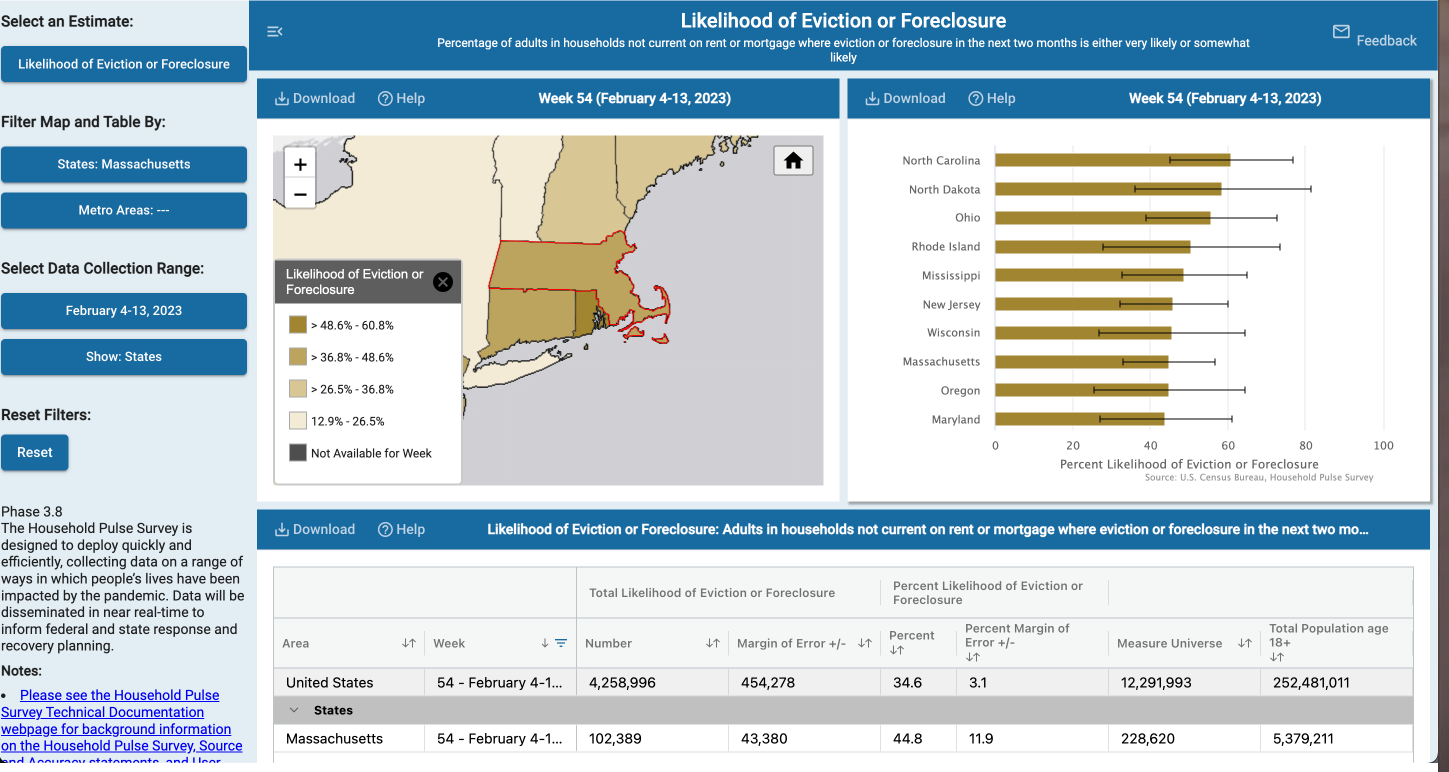
This tool, like a lot of the fun gadgets the Census Bureau puts together, allows you to highlight specific estimates, specific states, and then even specific metro areas within those states. You can change what set of data you want to be looking at (since the survey has been ongoing since 2020, there are multiple years and multiple cycles per year within which it's conducted).
"Pulse" seems like the best way to describe this survey, and an adequate name for how fast its content is being taken in, analyzed, and released only to then start anew with another cycle every few months or so. Census history can sometimes be defined by the experiments they did along the way, even just in who they decided to try including for once in their demographics, and it only makes sense that a pandemic would be a real bookmark in how they change things up and stay on the ball regardless.
Header image sourced with permission from ridhobadal.
This September marks the third annual campaign to raise disaster readiness and response education
A look at the Census Bureau's newest developments on the next decennial census