
Where in the U.S. has experienced the greatest increase in population?
About a month back we visited something called the "vintage census" (which you can read up on here!) that is essentially a living, breathing survey conducted consistently throughout the year. It is one tool, along with the standard Decennial Census and the American Community Survey, that best exhibits the fluctuations of populations around the country. What is the ratio of out-migration vs. in-migration? Where is everyone going? All these questions and more can be asked and then answered thanks to the data provided to the Census Bureau.
The reason why we bring up the vintage census and population specifically is that the 2022 Vintage Census was recently released, and with it came a swathe of publications around the Internet discussing its results! We wouldn't be Censtats if we didn't go on and on about census numbers so get ready for one more article on the pile.
To start, there are several charts floating around out there with the top ten counties who gained or lost population in the United States. The two kinds most often referred to are those who gained/lost population "numerically" or by "percentage." For example, in terms of the counties that gained the most, you can see the differences below:

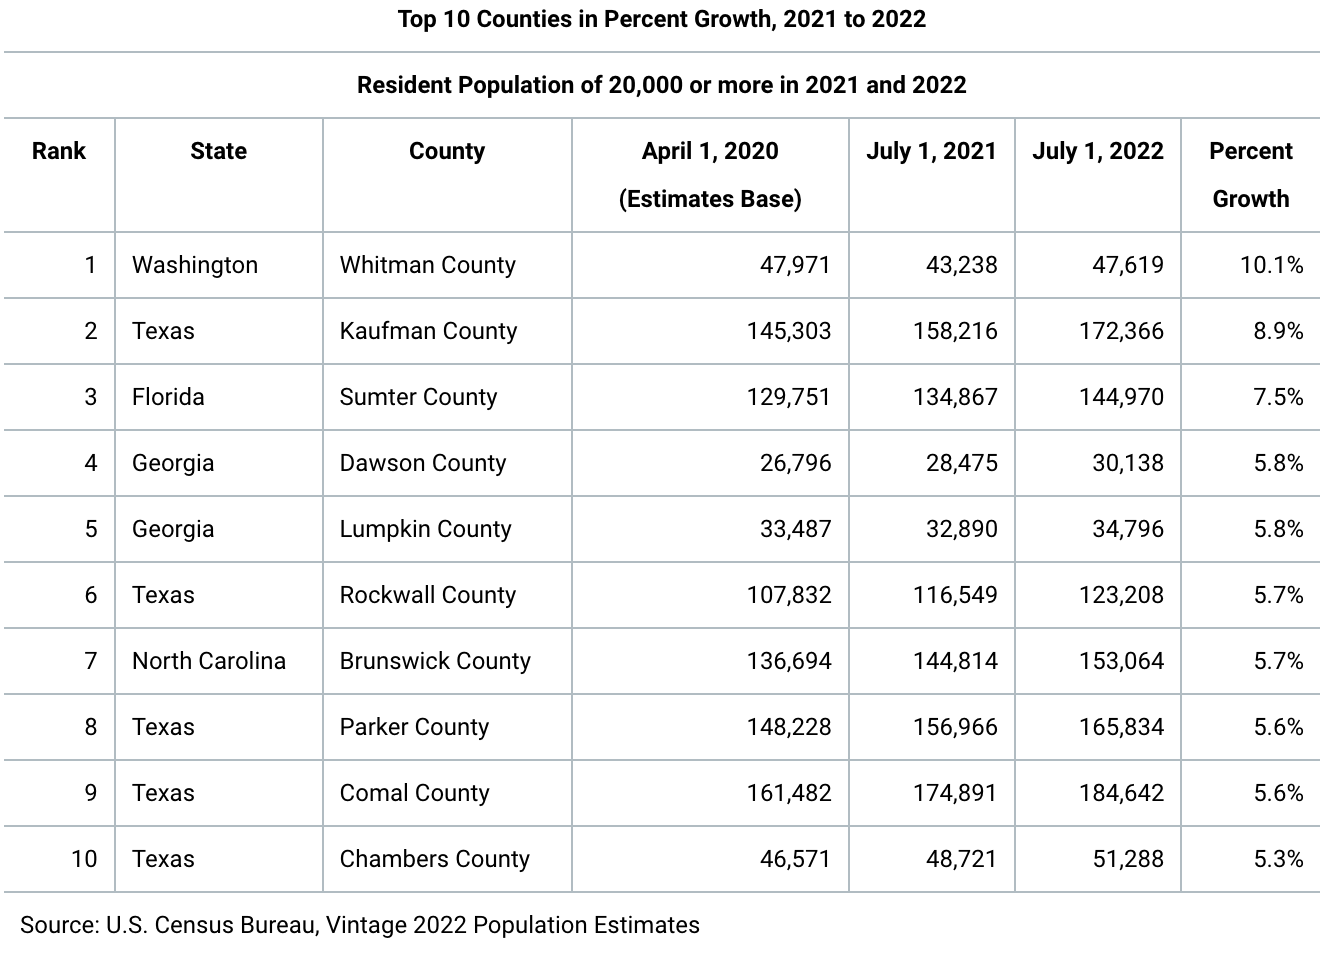
For the uninitiated, "numeric growth" counties are much more likely to be your bigger names like Maricopa County in Arizona while "percent growth" tend to be smaller. This is all due to the nature of higher numbers yielding lower percentages in terms of overall change and the opposite occuring for smaller numbers. Therefore, you end up with completely different lists based on the relative sizes of the counties.
Now beyond that incredibly surface level math lesson, what can be read from the data is that, according to the Census Bureau, effects of the pandemic on migration, both domestic and international, have begun to dissipate slightly. For example, it was very common for college students to move back home during this time, or at least away from campus, which resulted in outmigration of college towns. Whitman County, Washington, which tops the list of percent growth, is home to the University of Washington campus which could signal the return of pre-pandemic rates in those areas.
Aside from that, there's also the factor of cost of living around the country which may serve as one of several explanations for why Texas takes up half of both lists, on top of being the home of many tech companies. This coincides with Texas also now being only one of two states with a population of greater than 30 million (the other being California).
There are a variety of factors that influence these migrations, and with more on the way, like changes in climate and increasing cost of living, it makes things like the census even more important for analyzing these fluctuations from county to county and state to state. For further reading on this, you can take a look at the Census Bureau's publication on the matter here.
Header image sourced with permission from Dooder.
This September marks the third annual campaign to raise disaster readiness and response education
A look at the Census Bureau's newest developments on the next decennial census